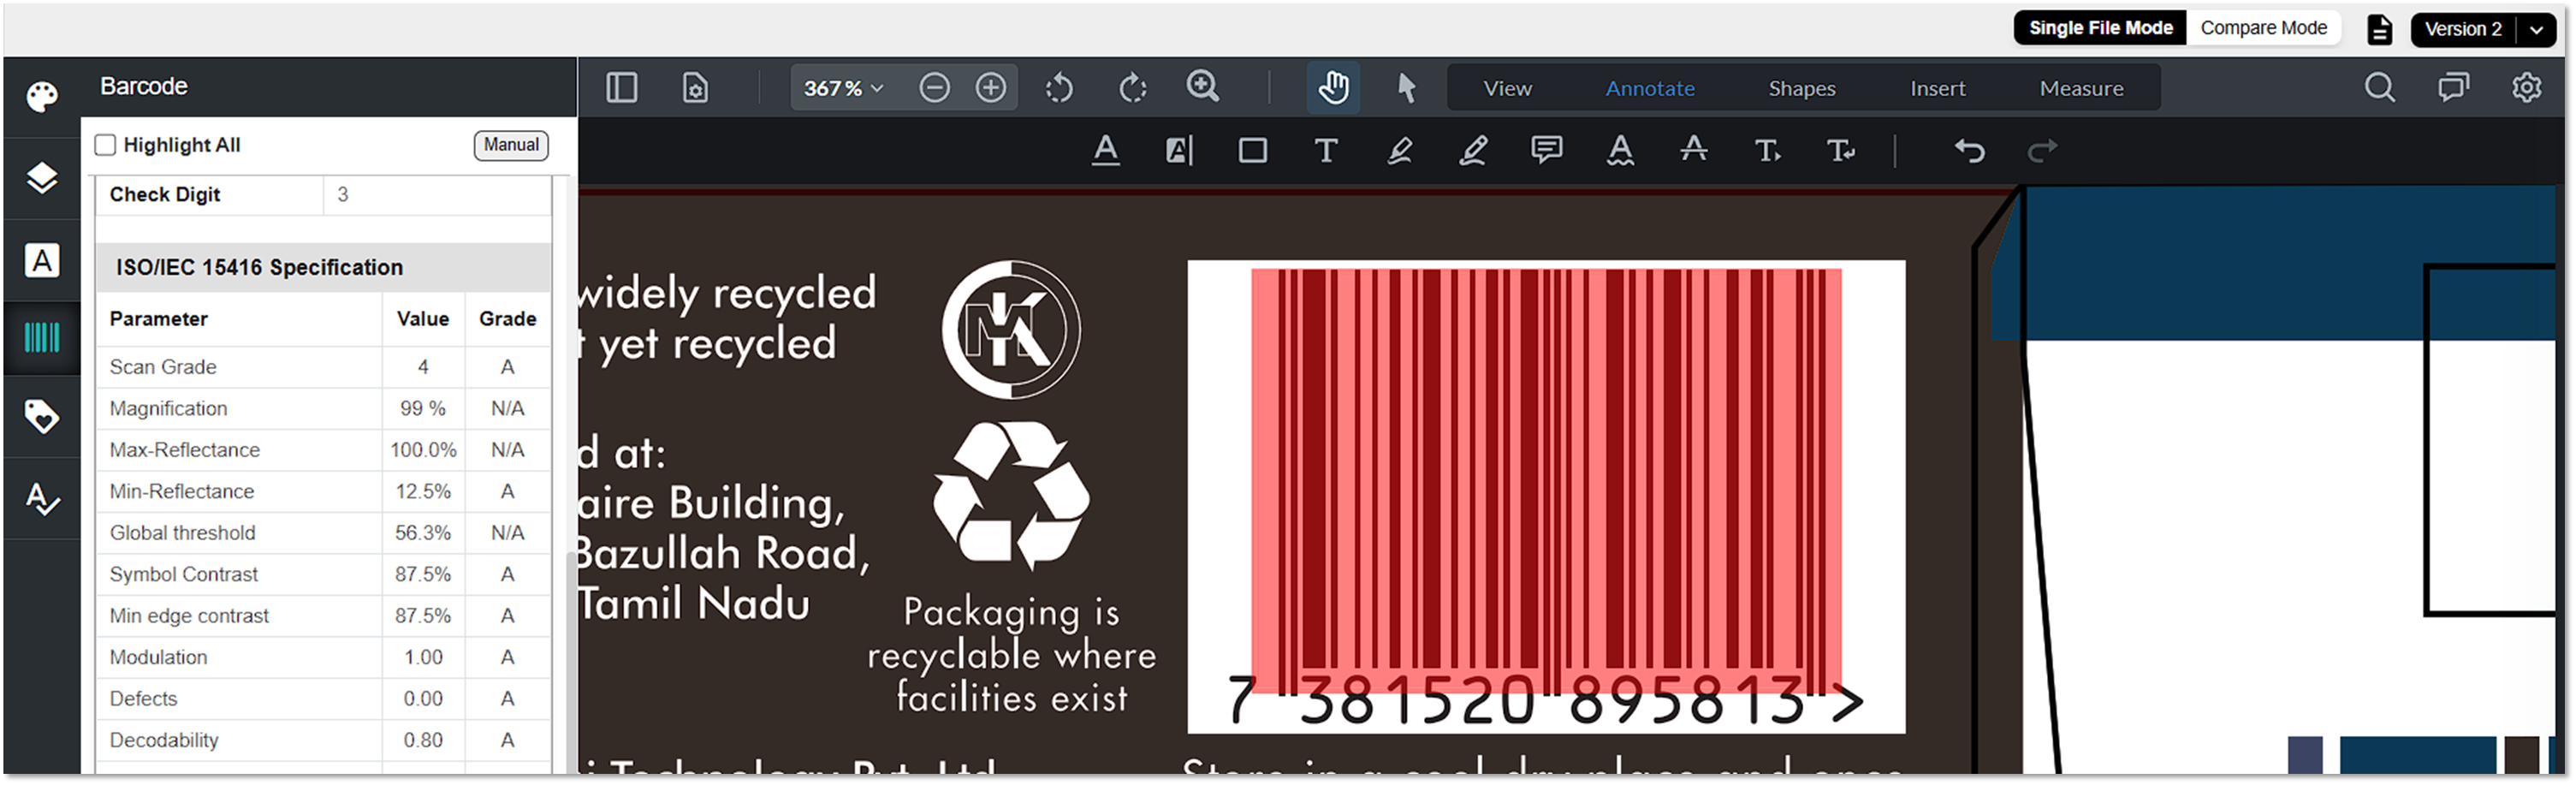
Detailed Barcode Parameter Information
Scan Grade
Scan Grade represents the quality and readability of the barcode based on the assessed parameters. The ISO/IEC standard specifies seven major parameters that should be measured and graded, the average of all seven parameters provides an overall grade for the bar code. In ISO terminology 4 is best, 0 is Fail, in ANSI terminology A is best, F is Fail. It assesses how accurately a barcode reader can decode a barcode.
Grade | Numeric Value |
A | 4 |
B | 3 |
C | 2 |
D | 1 |
F | 0 |
Decode
The Decode parameter determines whether the barcode has been correctly generated and can be successfully read. It evaluates factors such as:
- Ensures the barcode represents the correct characters.
- Verifies if the check digit is correctly calculated.
- Confirm that the bars and spaces are properly formed and distinguishable.
- Checks if the light margins around the barcode meet the required spacing for accurate scanning.
Grading System
- A barcode that meets all decoding criteria is assigned the highest grade (4).
- If the verifier fails to interpret the bars and spaces correctly, the barcode receives a failing grade (0).
This parameter is critical in determining barcode usability and compliance with industry standards.
Result | Value | Grade |
PASS | 4 | A |
FAIL | 0 | F |
Symbol Contrast (SC)
Symbol Contrast is the difference between the lightest and darkest part of the bar code: that is, the difference between the highest and lowest values in the Reflectance Profile.
SC = Rmax -Rmin
Result | Value | Grade |
>70 % | 4 | A |
55-70 % | 3 | B |
40-55 % | 2 | C |
20-40 % | 1 | D |
<20 % | 0 | F |
Min Reflectance (Rmin)
Min Reflectance is the darkest pixel value within a barcode image, also expressed in percentage.
A barcode image must have a minimum amount of reflective difference between the barcode and the background for the scanner to be able to see it at all. If the background is too dark or the barcode is too light, the scanner will struggle or fail to see it.
To ensure sufficient difference between the bars and the spaces, the bars must not be more than half the reflectance of the lightest space (Rmax). Another way to say this is, the reflectance of the bar must be equal to or less than half the reflectance of the background.
Result | Value | Grade |
Less than equal to Rmax | 4 | A |
Greater than Rmax | 0 | F |
Max Reflectance (Rmax)
Max Reflectance is the brightest pixel value within a barcode image, often expressed in percentage. It indicates how much light is reflected by the barcode and plays a crucial role in ensuring contrast between barcode elements for proper scanning. The system assigns a rating from 100-0.
Min Edge Contrast (MinEC)
Min Edge Contrast is the minimum brightness difference required between barcode bars and spaces for successful detection and decoding. Checks that the contrast between adjacent bars and spaces is high enough. When a barcode is scanned, a reading device must locate the edges between each bar and space. If the difference in the light and dark elements is not significant, this may not be achieved. Note that MinEC finds the worst-case contrast difference between each bar to space transition, whereas symbol contrast finds the best-case difference at any point across the barcode.
Result | Value | Grade |
>= 15% | 4 | A |
< 15% | 0 | F |
Modulation (MOD)
Modulation measures the consistency of contrast between the darkest and lightest elements in a barcode. It is defined as the ratio of Minimum Edge Contrast (MinEC) to Symbol Contrast (SC):
MOD = MinEC/SC
- Modulation evaluates the minimum edge contrast relative to the overall contrast, ensuring that barcode readers can accurately detect transitions between bars and spaces.
- Most barcode scanners use adaptive thresholding circuits, which are sensitive to contrast variations. A lower modulation score indicates potential readability issues.
Understanding Modulation Scores:
- If all bars and spaces have uniform brightness, Modulation = 1 meaning the barcode is ideally scannable.
- If some spaces are darker than the brightest one, modulation decreases, affecting readability.
- The worst-case bar-to-space transition determines the final modulation score, which is assigned a letter grade based on industry standards.
- Maintaining a high modulation percentage is crucial for ensuring barcode scanning accuracy and reliability across different devices.
Result | Value | Grade |
>= 0.70 | 4 | A |
>= 0.60 | 3 | B |
>= 0.50 | 2 | C |
>= 0.40 | 1 | D |
< 0.40 | 0 | F |
Defects
Defects measure irregularities within barcode elements, identifying imperfections that may impact readability while still allowing for successful scanning. The Defect value is calculated as the ratio of the maximum reflectance non-uniformity (ERNmax) to Symbol Contrast (SC).
Defects = ERNmax/SC
Common barcode defects include:
- Breaks or voids in bars (gaps in printed ink).
- Ink spots or smudges in spaces (unwanted marks reducing contrast).
- Substrate grain interference, which can cause inconsistencies in reflectance.
Traditional barcode verification methods did not directly assess defects, despite their significant impact on scanner performance. Detecting and minimizing defects is crucial for ensuring barcode accuracy, consistency, and scan reliability across different printing and scanning conditions.
Result | Value | Grade |
<= 0.15 | 4 | A |
<= 0.20 | 3 | B |
<= 0.25 | 2 | C |
<= 0.30 | 1 | D |
> 0.30 | 0 | F |
Decodability
Decodability is a measure of how easily distinguishable the different sizes of bars and spaces are in a bar code. The better a bar code is printed, the more easily a scanner can identify bars and spaces, and the higher the grade assigned by the verifier.
Printing errors (or damage) could mean that a narrow bar might be mistaken for a wide bar. For each type of bar code, it’s possible to calculate the point at which a bar of one type could be mistaken for another. This is a measure of the bar code’s tolerance. Decodability is the fractional amount of this tolerance remaining.
Result | Value | Grade |
>= 0.62 | 4 | A |
>= 0.50 | 3 | B |
>= 0.37 | 2 | C |
>= 0.25 | 1 | D |
< 0.25 | 0 | F |
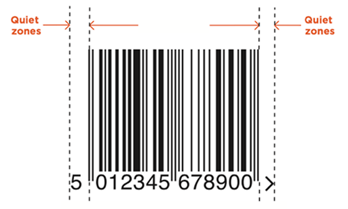
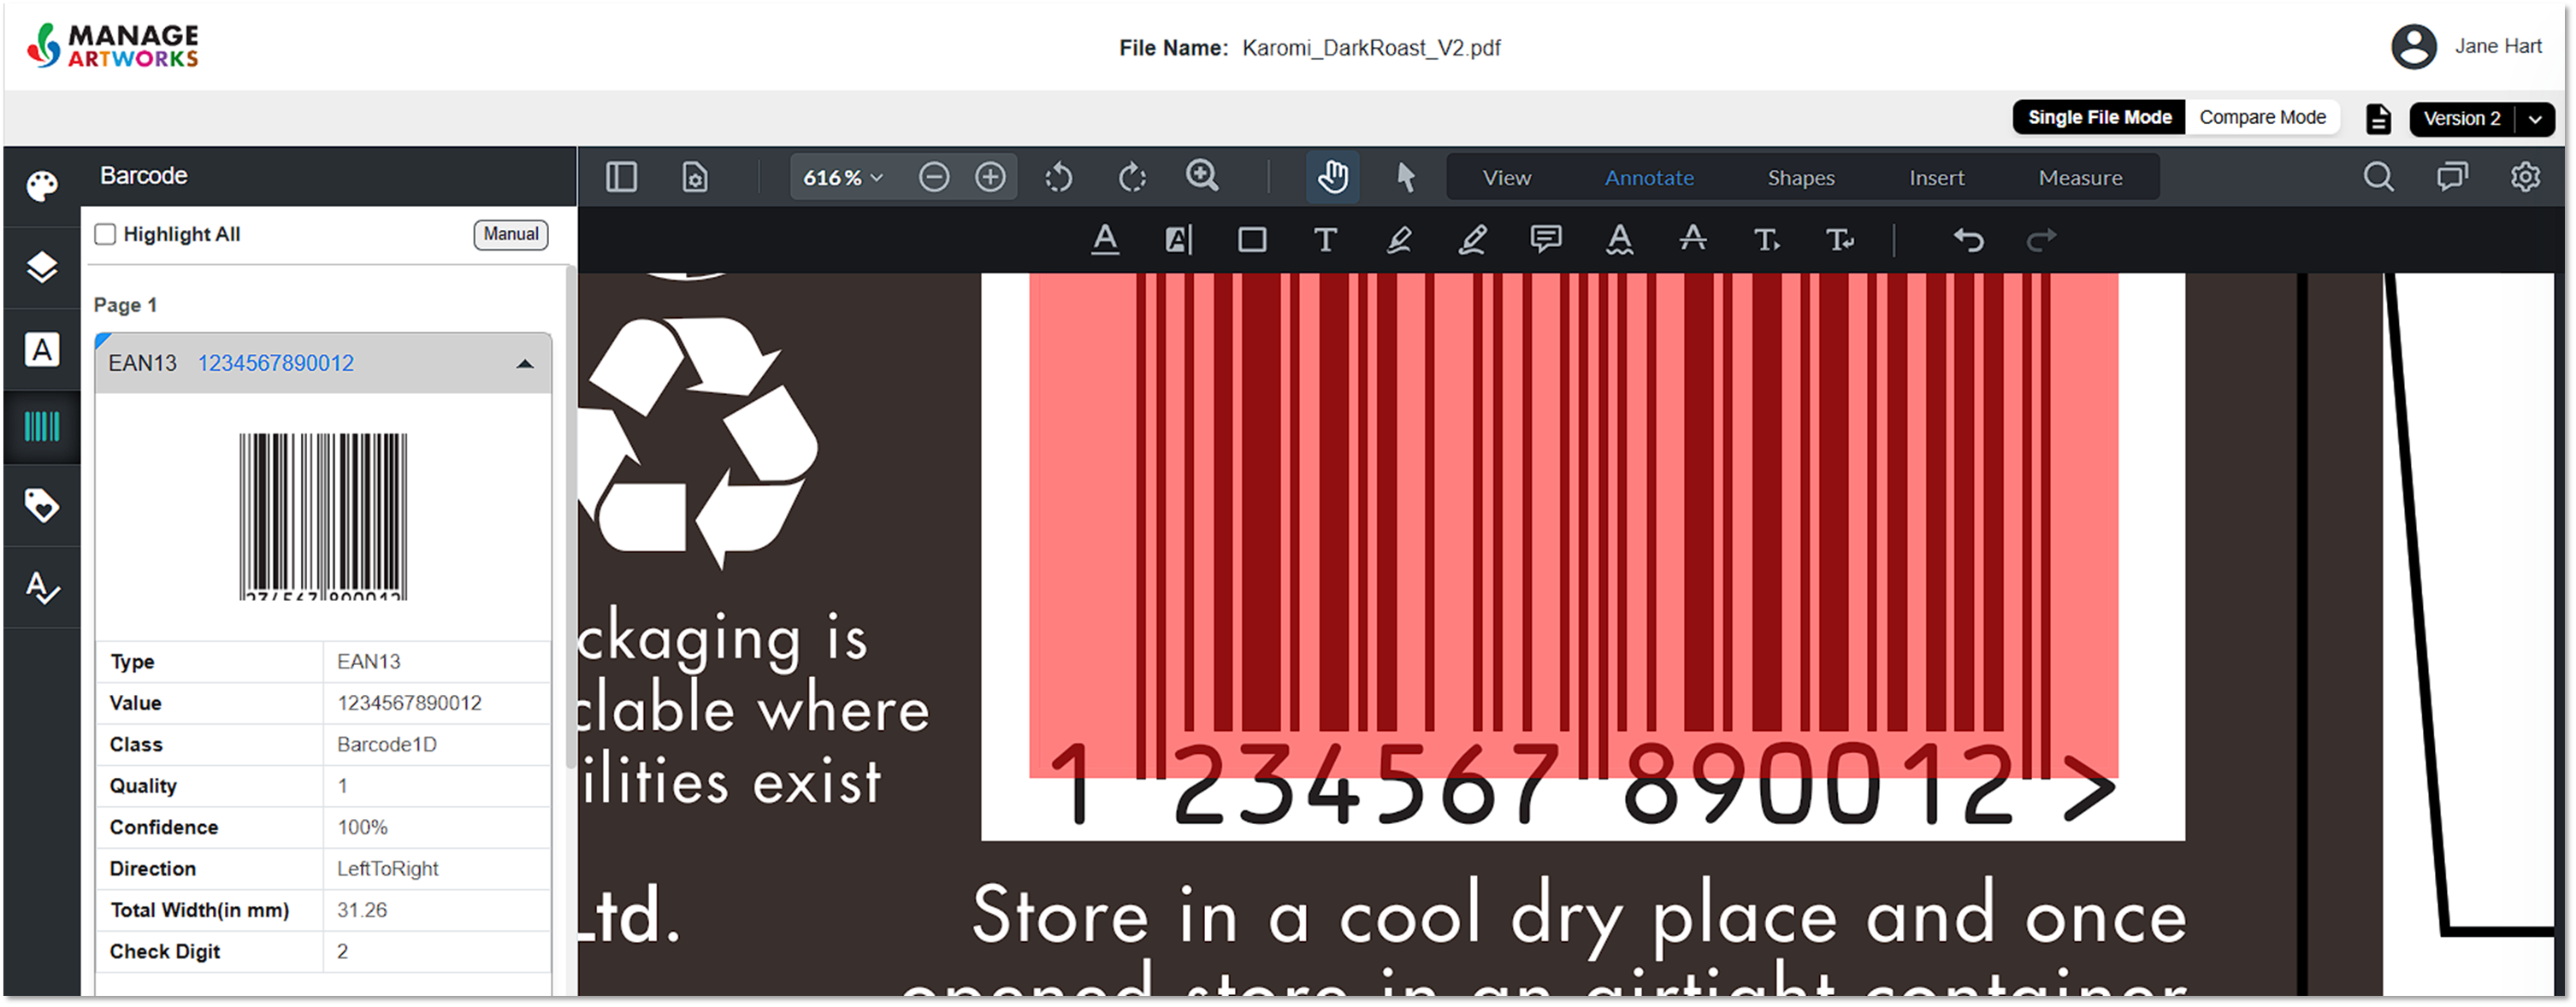
Quiet Zone (QZ)
Having space on each side of a barcode is crucial for the scanner to identify where the barcode begins and ends. These spaces are known as Quiet Zones. Quiet Zones should always match the color used for the barcode’s spaces (typically white) and nothing at all should be printed in these areas.
On the EAN-13 barcode, the first digit of the GTIN shows how much space is required on the left-hand side. On the right-hand side of the symbol, you sometimes see a little arrow called the Quiet Zone indicator which also shows how much space is required. This indicator is optional but is recommended as it helps safeguard the right-hand Quiet Zone.
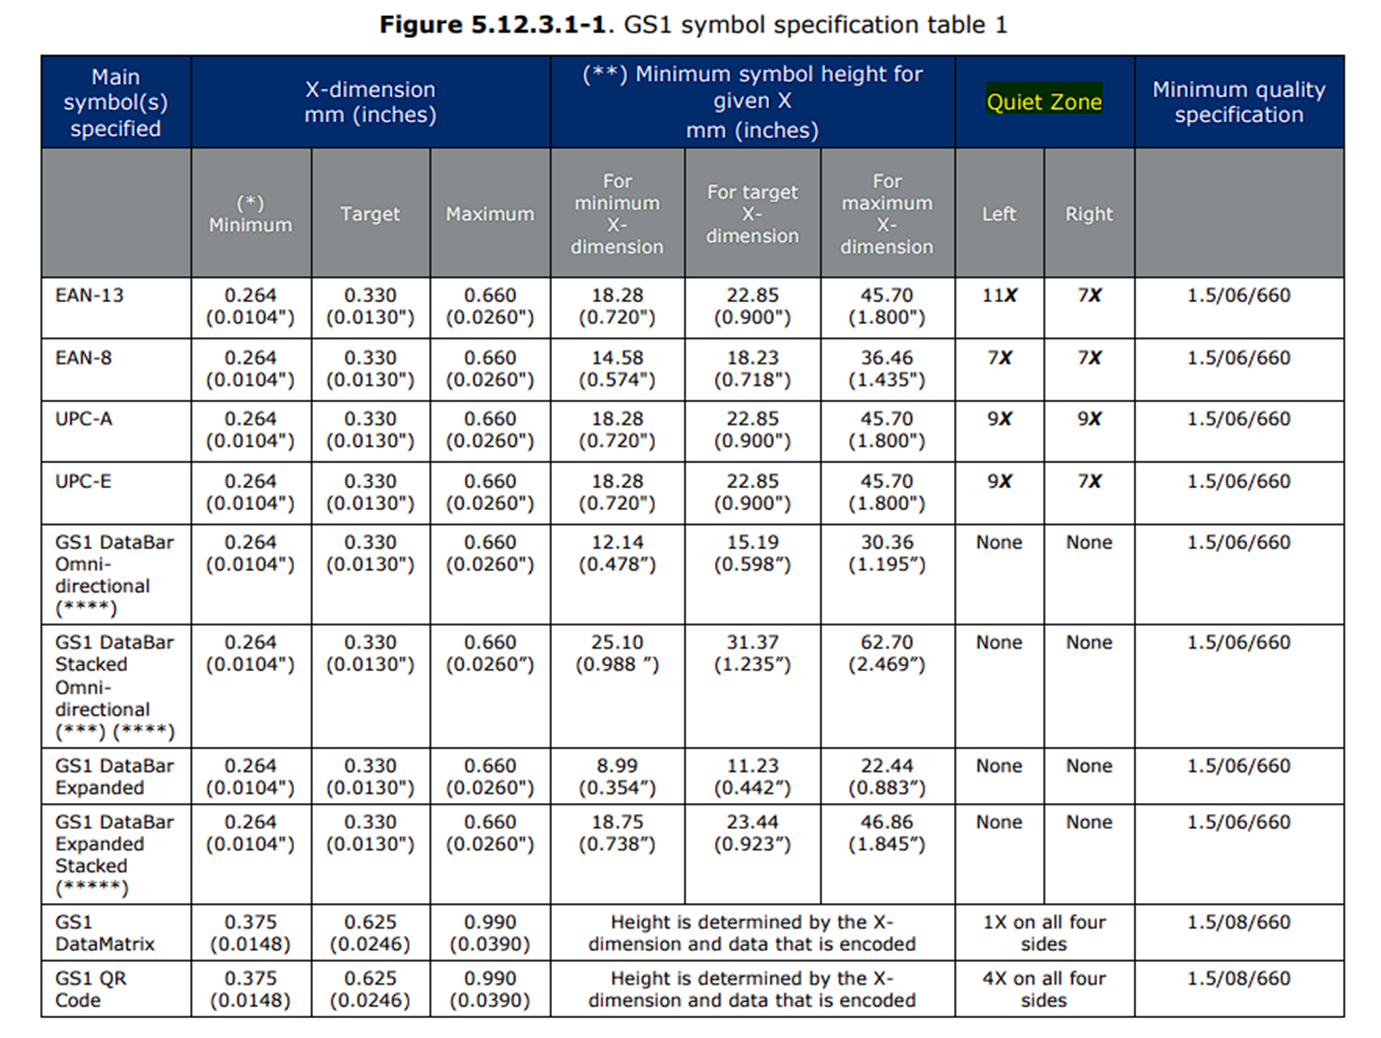
X-Value and Quiet Zone in GS1 Standards
In the GS1 standard, X refers to the narrowest bar size within a barcode. The quiet zone is typically defined as a multiple of X. For example, if the quiet zone is specified as 10X, it means the clear space around the barcode must be 10 times the width of the narrowest bar.
By default, GS1 specifies the X-value and quiet zone requirements for different barcode types. Our system considers these GS1-defined values as 100% accuracy benchmarks. When analyzing a barcode, the system calculates a percentage score based on the detected X-value and quiet zone. A 100% score indicates full compliance with GS1 standards.
For detailed quiet zone specifications, please refer to the GS1 specification document.
Axial Non-uniformity (AN) (Only for 2D Barcodes)
2D symbol modules must be in a square shape. When they together form a symbol, they lay in a regular square (if GS1 DataMatrix they may also be in rectangular form) grid with even scaling to the finder patterns.
Axial non-uniformity tests for uneven scaling of the symbol on a scale of 4 to 0.
AN = abs (XAVG – YAVG) / ((XAVG+YAVG)/2)
XAVG = average spacing to the X axis
YAVG = average spacing to the Y axis
Result | Value | Grade |
≤ 0.06 | 4 | A |
≤ 0.08 | 3 | B |
≤ 0.10 | 2 | C |
≤ 0.12 | 1 | D |
> 0.12 | 0 | F |
Grid Non-uniformity (Only for 2D Barcodes)
Grid non-uniformity measures the largest deviation of grid intersections in a barcode from their ideal theoretical positions. It evaluates how accurately the data area's grid aligns with the expected structure in a perfectly formed symbol.
The system grades grid non-uniformity on a scale of 4 to 0, where the largest vector deviation is expressed as a fraction of the X-dimension (the narrowest bar or module width). A higher deviation results in a lower grade, indicating potential readability issues.
Result | Value | Grade |
≤ 0.38 | 4 | A |
≤ 0.50 | 3 | B |
≤ 0.63 | 2 | C |
≤ 0.75 | 1 | D |
> 0.75 | 0 | F |
Unused Error Correction (UEC) (Only for 2D Barcodes)
The unused error correction measures and grades on the 4 to 0 scale the reading safety margin that error correction provides. Unused error correction indicates the amount of available error correction in a symbol.
UEC = 1.0 – ((e + 2t) / ECAP)
e = the number of deletions (erased or rubbed areas)
t = the number of errors
ECAP = The error correction capacity of the symbol, it is selected when you want to construct the symbol.
If no error correction has been applied and the symbol decodes perfectly well UEC = 1, if deletions and double of the number of errors are greater than the error correction capacity, then UEC = 0. UEC is calculated for each block of data and minimum shall be used for grading.
Result | Value | Grade |
≥ 0,62 | 4 | A |
≥ 0,50 | 3 | B |
≥ 0,37 | 2 | C |
≥ 0,25 | 1 | D |
< 0,25 | 0 | F |
Magnification
The magnification parameter is essentially a scale factor that indicates how much a barcode’s printed dimensions deviate from the nominal or “100%” size defined by the standard. For example, a barcode printed at 80% magnification means every element—its bars, spaces, quiet zones, and even the overall symbol size—is 80% of the nominal size. This parameter is critical in barcode verification because it ensures that the printed barcode falls within the acceptable dimensional tolerances (such as the typical range of 80%–200% for retail applications, with on-demand processes sometimes allowed a minimum of 75%) so that it can be reliably scanned by various devices. In short, magnification tells you whether the barcode has been scaled correctly, which in turn influences scan ability and overall quality.
Achievable Magnification (X-dimensions) for thermal printed EAN/UPC symbols
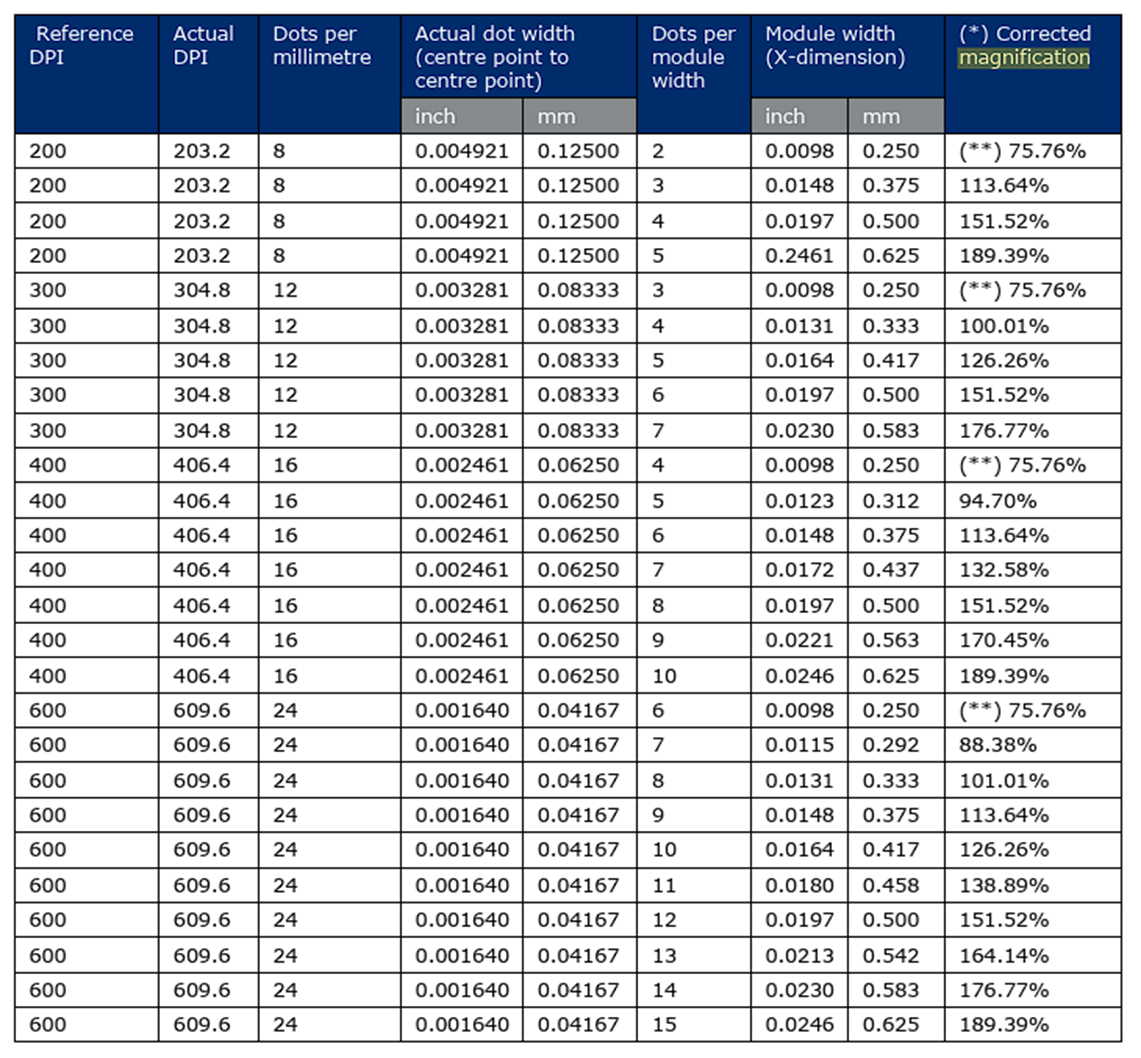
The allowance for symbols from the EAN/UPC symbology family of magnifications from 75 to 80 percent is only applicable to on-demand (e.g., thermal, laser) print processes. For all other printing processes, 80 percent is attainable and is the minimum allowable size.
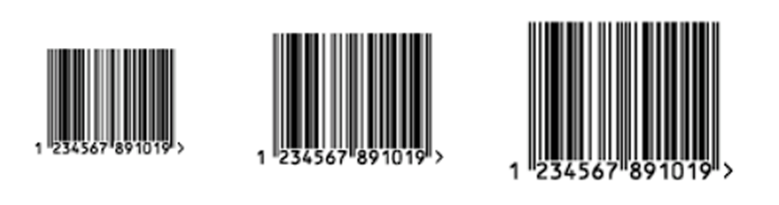
In the example below, you can see the same barcode at 80%, 100% and 120% magnification.
For more details about the magnification, refer to the GS1 Specification.
Global Threshold
The Global Threshold is the midpoint between the highest (Max Reflectance) and lowest (Min Reflectance) reflectance values in the Scan Reflectance Profile.
Formula:

Bar Width Reduction (BWR)
Bar Width Reduction (or BWR) is adjusting the barcode bars thickness to compensate for ink spread when printing. Say if you draw with a marker pen on a very soft paper the ink will most likely spread and the line will become wider — the same might happen when you print, just not at that extent.
Ink spread, or “dot gain” or “press gain” may increase the width of the bars of the barcode and make it more difficult to scan. This is more common for traditional printing press, rather than office printers, but it is not just about printers. It also depends on ink, the substrate, the condition of the press, the room temperature and much more.
In order to avoid the scanning problems, you might need to compensate for the ink spread by making the bars a little narrower, so they come to the normal thickness after printing and ink spreading.
Confidence
Confidence represents probability, in percents, that the barcode is recognized correctly.
Minimal confidence level set in the Reader Settings is 95 (MinConfidence Property (ReaderSettings)). Barcodes with confidence levels less or equal to this value are ignored by the system.
Confidence values for 1D barcodes:
| 0% | Barcode is unsolved, there are some unsolved symbols. |
| 50% | Barcode is read, all symbols are read but some of symbols are not recognized, checksum is not correct. |
| 100% | Barcode is recognized, all symbols of barcode are recognized, checksum is correct |
| NA (101%) | Barcode is recognized/read, all symbols of barcode are recognized/read, checksum cannot be checked because this barcode type does not have checksum. |
Confidence values for 2D barcodes:
| 0 - 10% | Barcode is unsolved, start symbol of barcode is read, data area and area of the error correction cannot be read. |
| 10.1 - 50% | Barcode is unsolved, there are unrecognized or unsolved symbols in data area, area of the error correction or first line of barcode cannot be read |
| 50.1 - 95% | Barcode is read, there are unrecognized or unsolved symbols in data area and/or area of the error correction, the error correction algorithm cannot correct symbols |
| 99% | Barcode is recognized, there were unrecognized symbols in data area and/or area of the error correction but symbols were corrected with the error correction algorithm, checksum is correct. |
| 100% | Barcode is recognized, all symbols from data area and error correction area are recognized, checksum is correct. |
Check Digit/Character Calculations
The check digit is a value calculated from the barcode data which indicates the last digit of the barcode value, used to validate the accuracy of the barcode. It ensures that the barcode data is correctly formatted and follows the necessary checksum algorithm (e.g., Modulo 10).
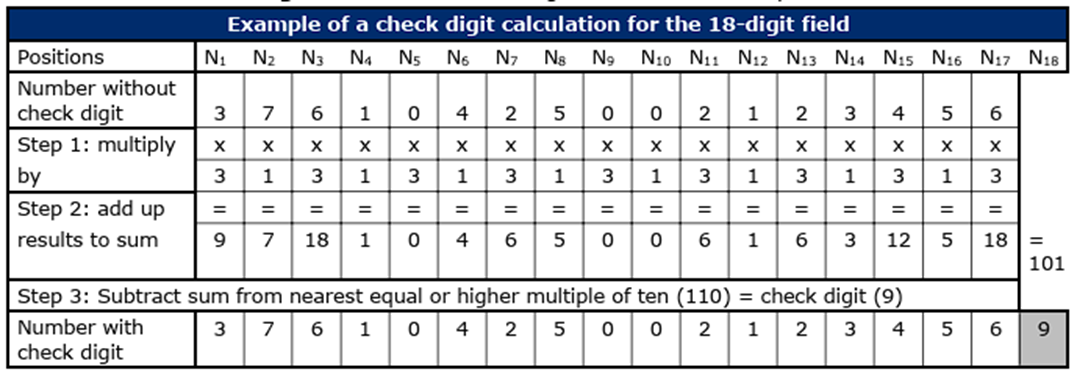
Standard check digit calculations for GS1 data structures
This algorithm is identical for all fixed length numeric GS1 data structures (including GDTI, GLN, GRAI, etc.) that require a check digit.
Check digit algorithm
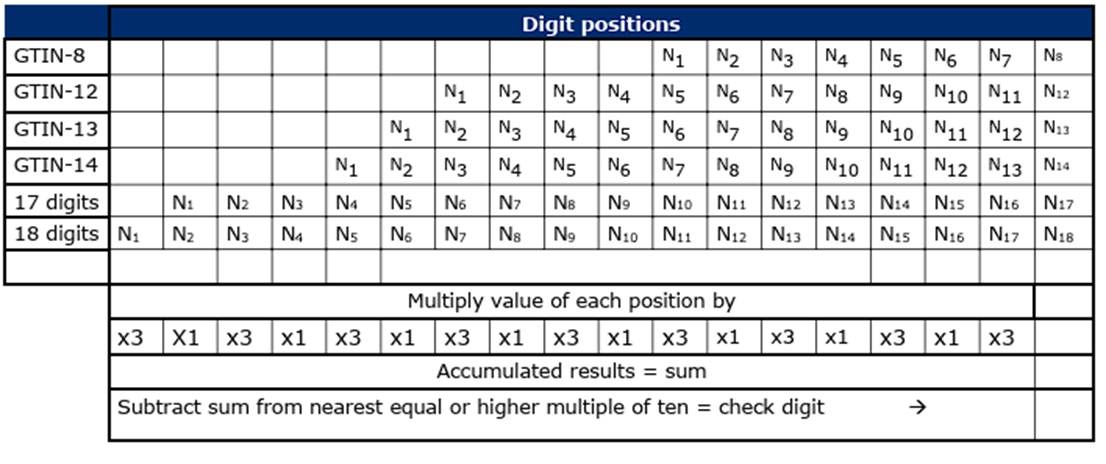
Check digit calculation example