Reports (Growth Plan)
 | Note: This article covers the Reports module available in the Growth plan. For information on the Reports module in the Enterprise plan, refer to Reports (Enterprise Plan). For more information on all ManageArtworks plans, click here. |
 | Tip: You can click on any chart or entry within the report to view its detailed drill-down. |
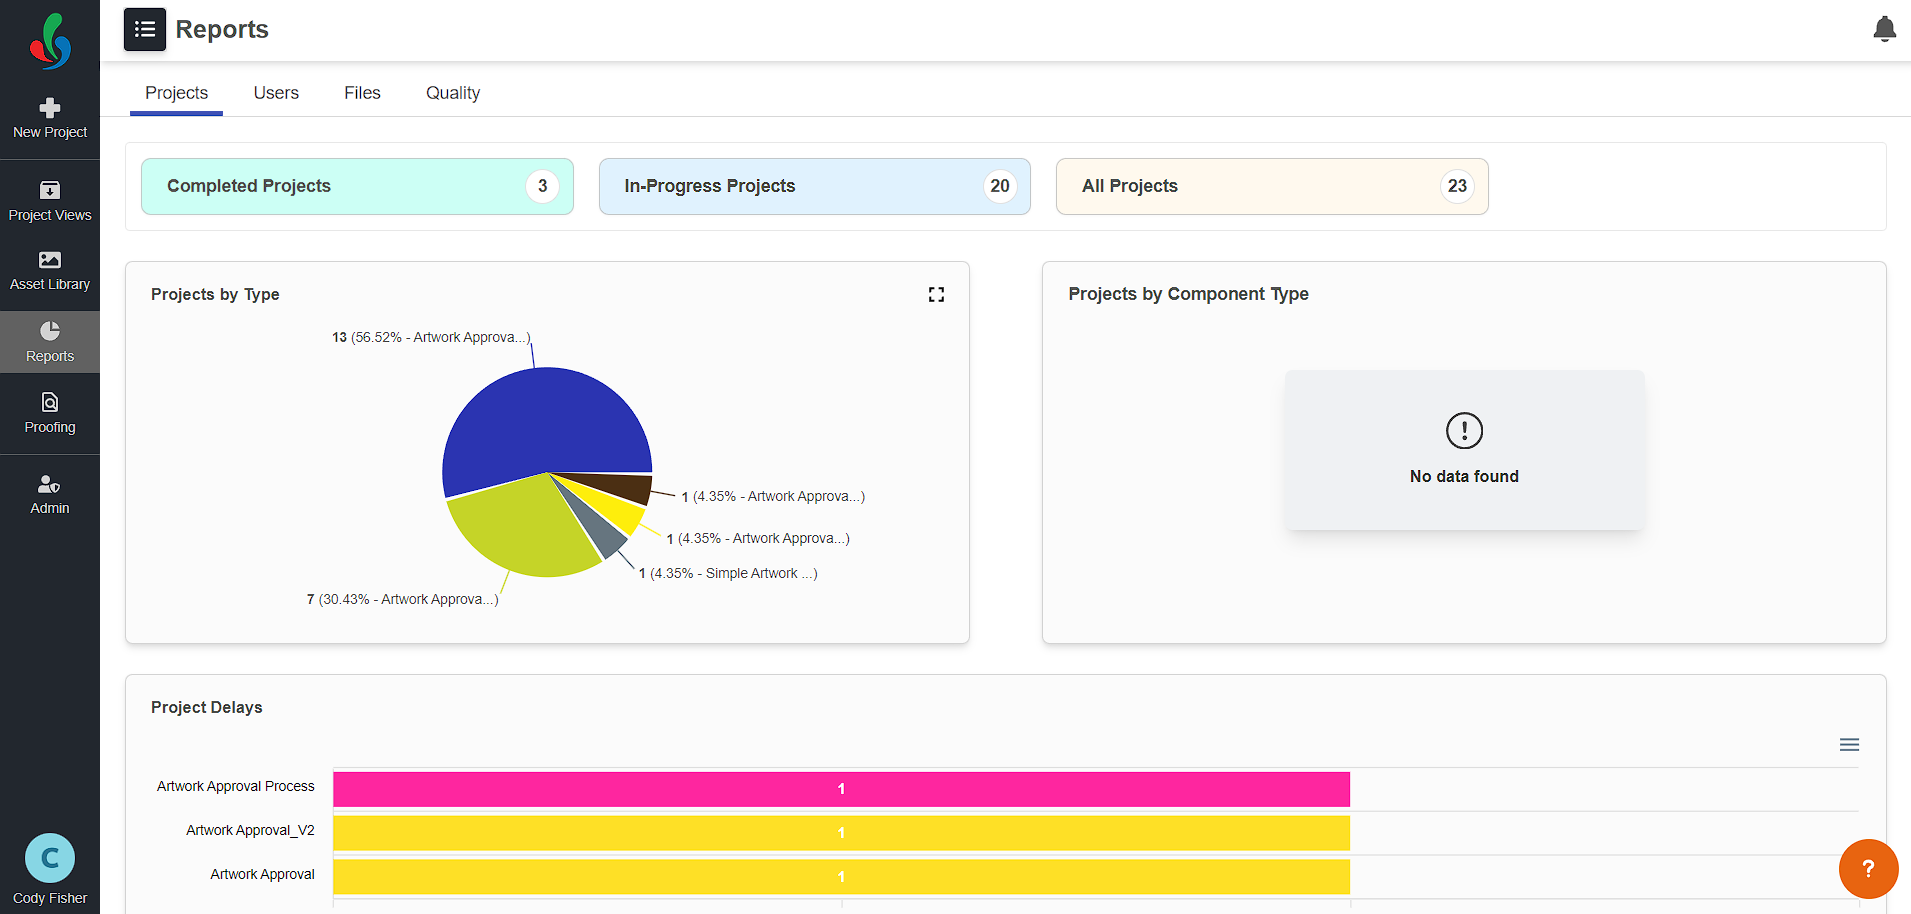
Project Reports
Within the Project section of the Reports module, users can access a variety of reports focusing on different aspects of project management:
- Completed Projects: This report provides a comprehensive overview of workflows that have been successfully completed within the system. It offers valuable insights into the successful execution of projects.
- In-Progress Projects: Users can monitor projects that are currently in progress through this report. It offers real-time visibility into ongoing activities, aiding in project tracking and management.
- All Projects: The Total Workflows report provides a holistic view of all workflows, including completed and ongoing projects. This report aids in understanding the overall project landscape.
- Projects by Type: Users can categorize, and view projects based on their types. This report allows for the classification and analysis of projects, facilitating better project categorization.
- Projects by Component Type: This report offers insights into projects categorized by their component types. Users can gain a deeper understanding of the composition of different projects.
- Project Delays: Project delays can have a significant impact on project management. This report highlights the on-time and delayed projects count.
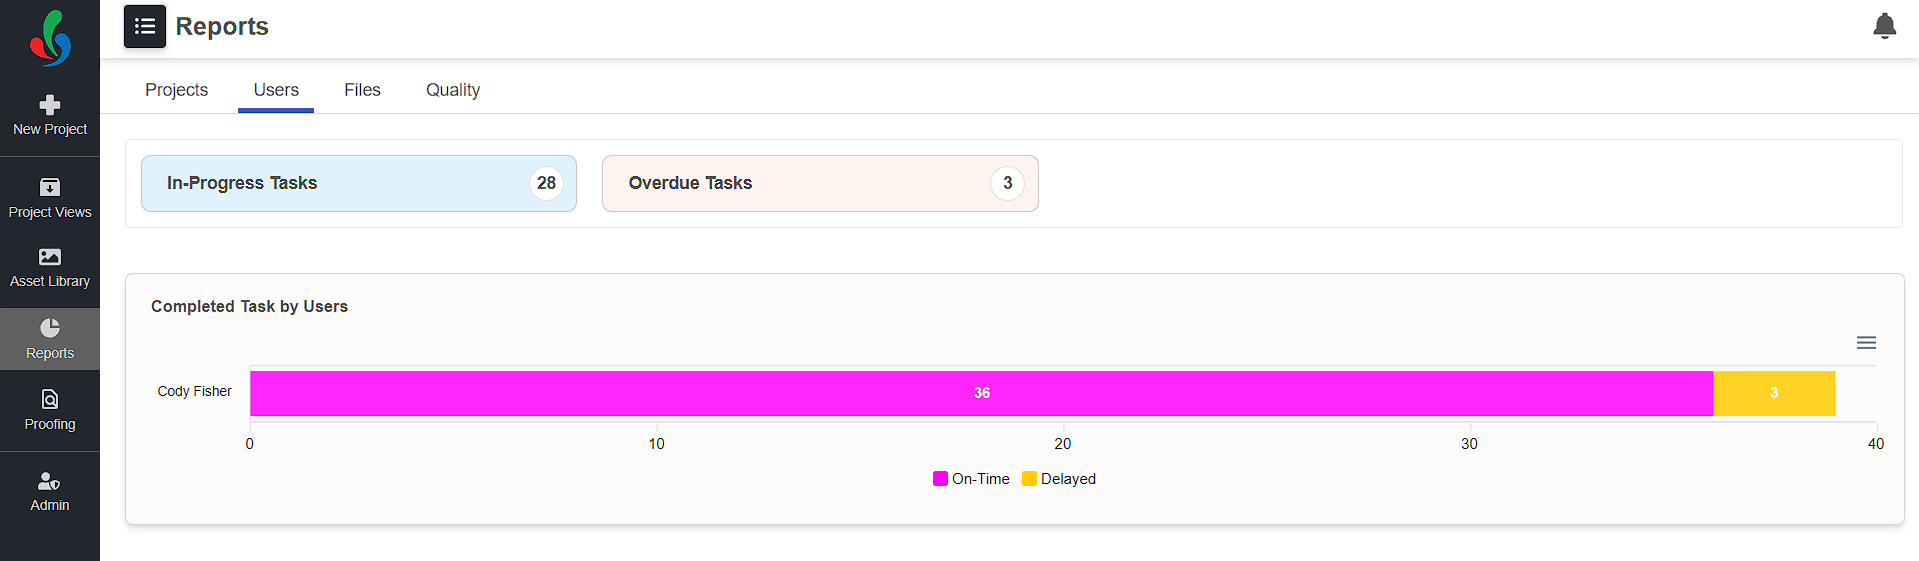
User Reports
In the User section of the Reports module, users can access a set of reports related to individual user activities:
- In-Progress Tasks: Users can track tasks that are currently in progress through this report. It aids in monitoring ongoing activities and ensuring timely task completion.
- Overdue Tasks: Timely task completion is critical. This report highlights tasks that are overdue, allowing users to identify and address delayed assignments promptly.
- Completed Task by User: This report provides insights into task completion by individual users. It enables the evaluation of individual performance and productivity.
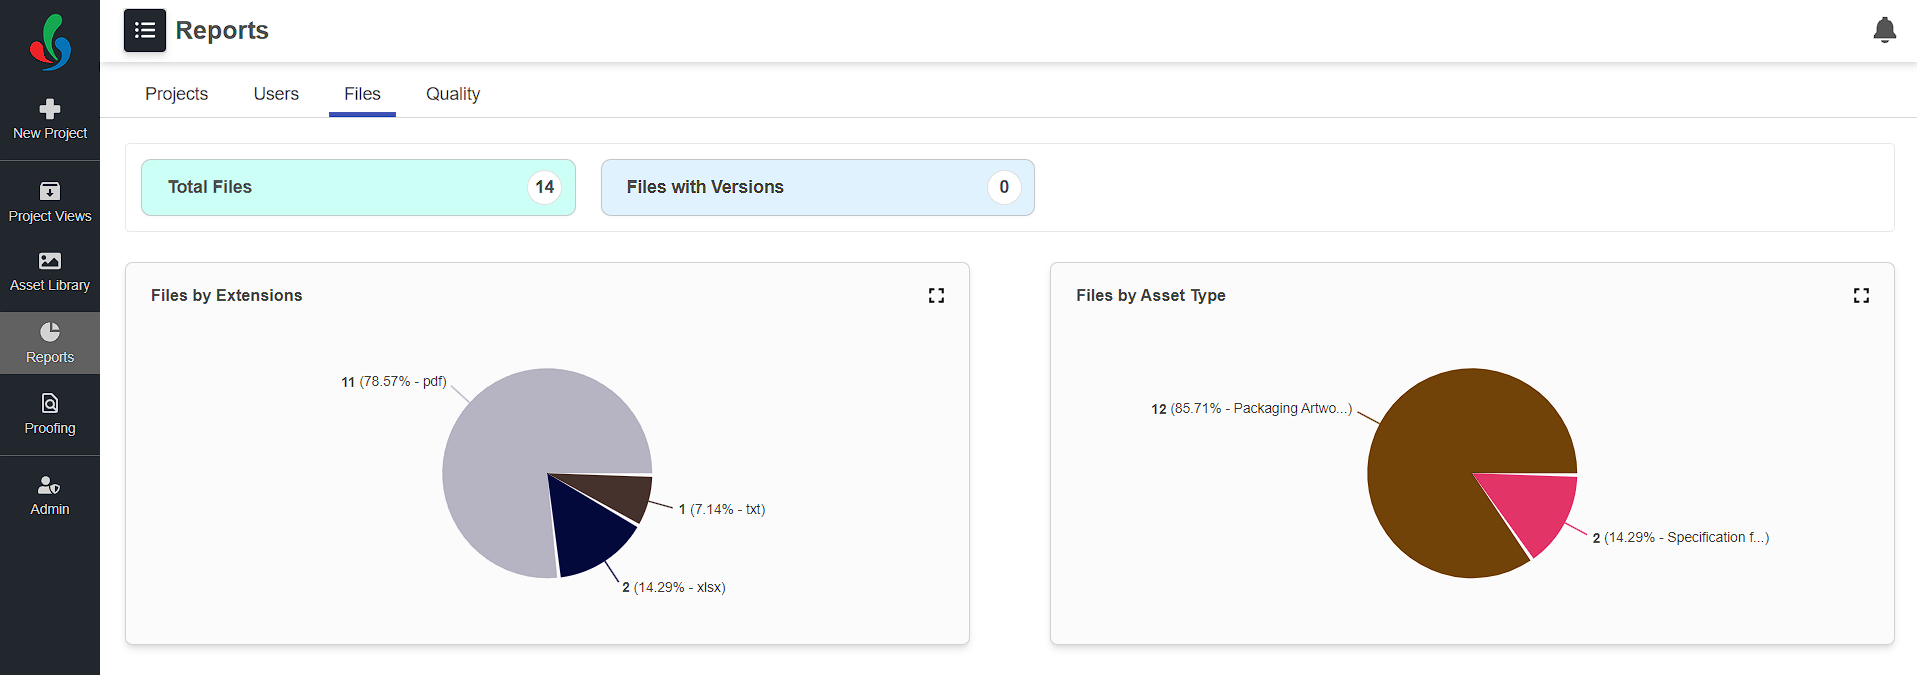
Files
In the "Files" section of ManageArtworks, users can access detailed reports related to the following aspects:
- Total Files:
- Provides the total count of files within the system.
- Offers a quick snapshot of the overall volume of files stored in ManageArtworks.
- Files with Versions:
- Displays the count of files that have multiple versions.
- Helps in identifying and managing files that have undergone revisions or updates.
- File by Extensions:
- Lists the various file extensions present in the system.
- Offers insight into the diversity of file types used, aiding in compatibility and organization.
- File by Asset Type:
- Categorizes files based on their types (e.g., packaging artwork, dieline, KLD).
- Allows users to understand the distribution of file types, facilitating efficient file management.
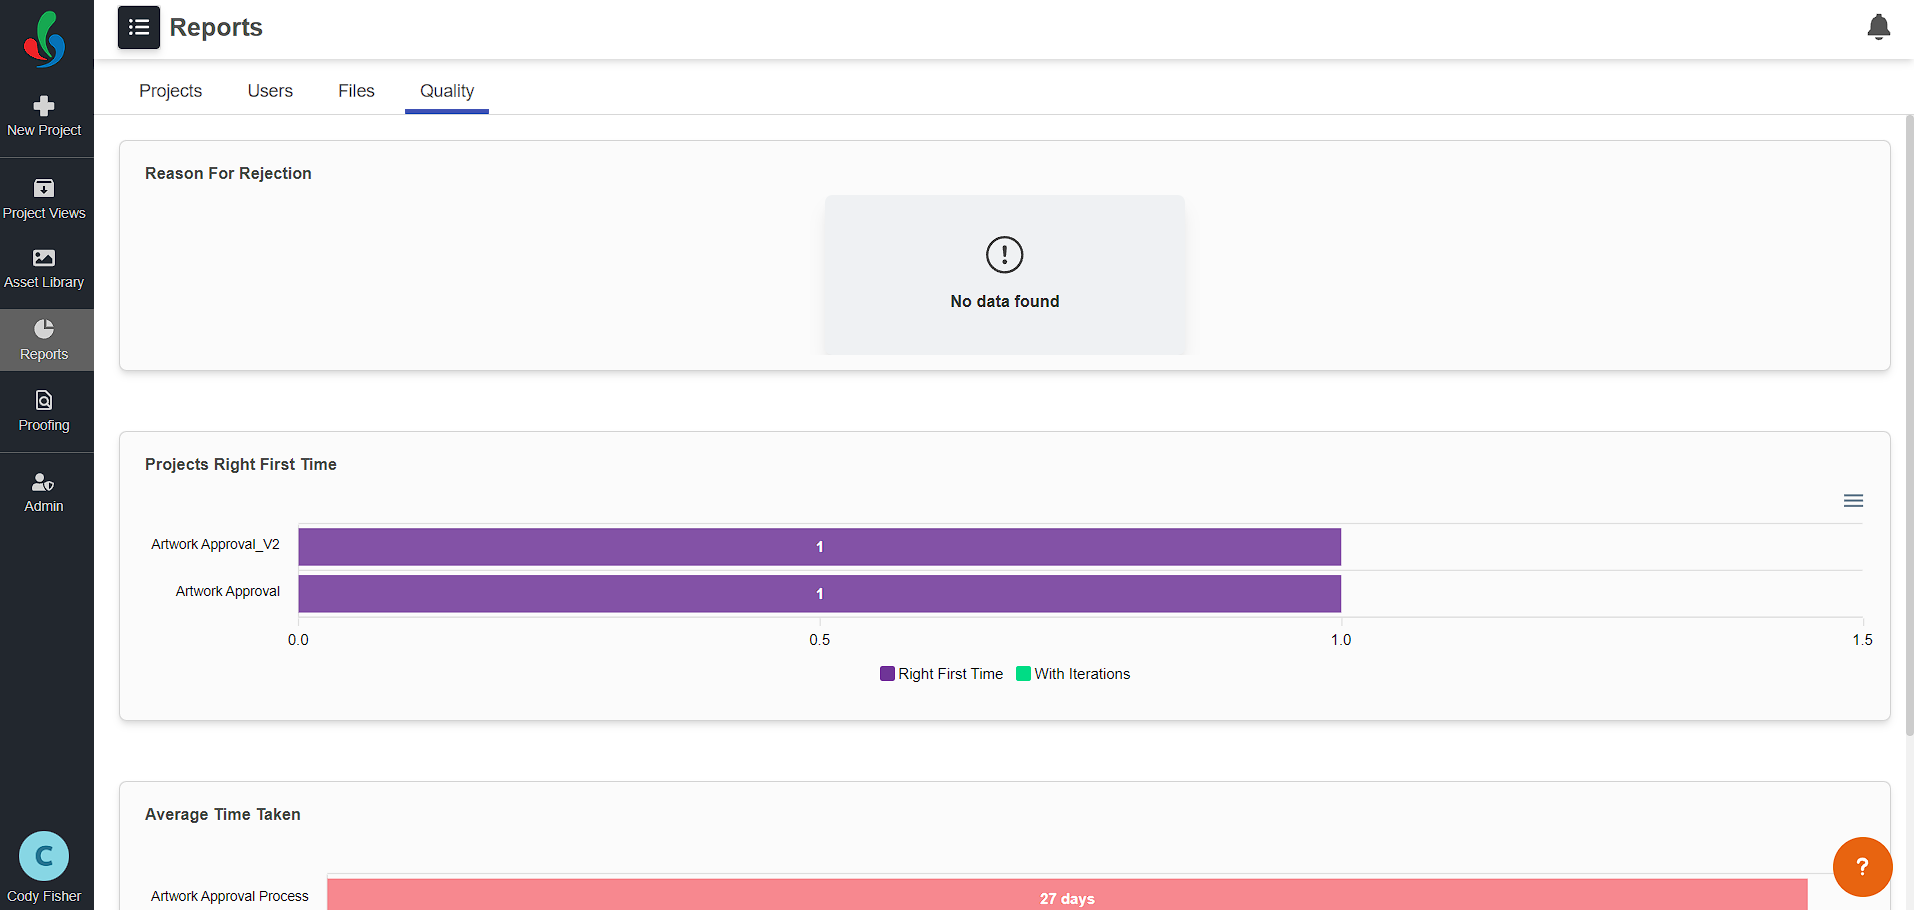
Quality
Within the "Quality" section of ManageArtworks, users can access insightful reports covering key aspects:
- Reason For Rejection:
- Provides an overview of the quality metrics and parameters within the system.
- Offers a general assessment of the quality landscape, allowing users to gauge the overall quality status.
- Projects Right First Time:
- Presents a count and percentage of projects that were successfully completed without the need for revisions.
- Indicates the efficiency of project execution and serves as a measure of the accuracy and precision achieved in the initial project attempts.
- Average Time Taken:
- Displays the average duration taken for the completion of projects or specific quality-related processes.
- Assists in evaluating the time efficiency of the quality-related workflows, providing insights into process optimization opportunities.
Reports: Detailed Drill-Down View
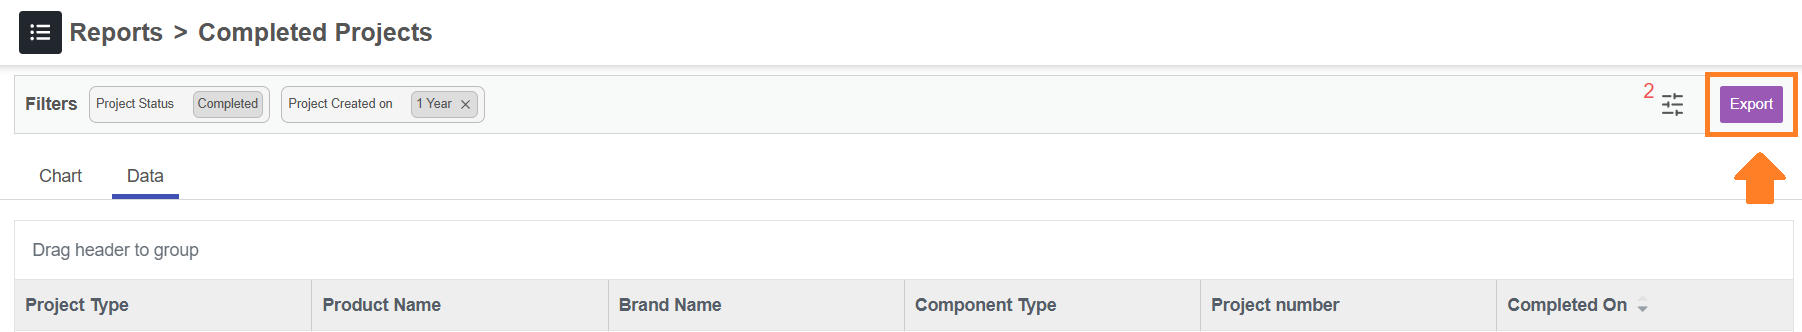
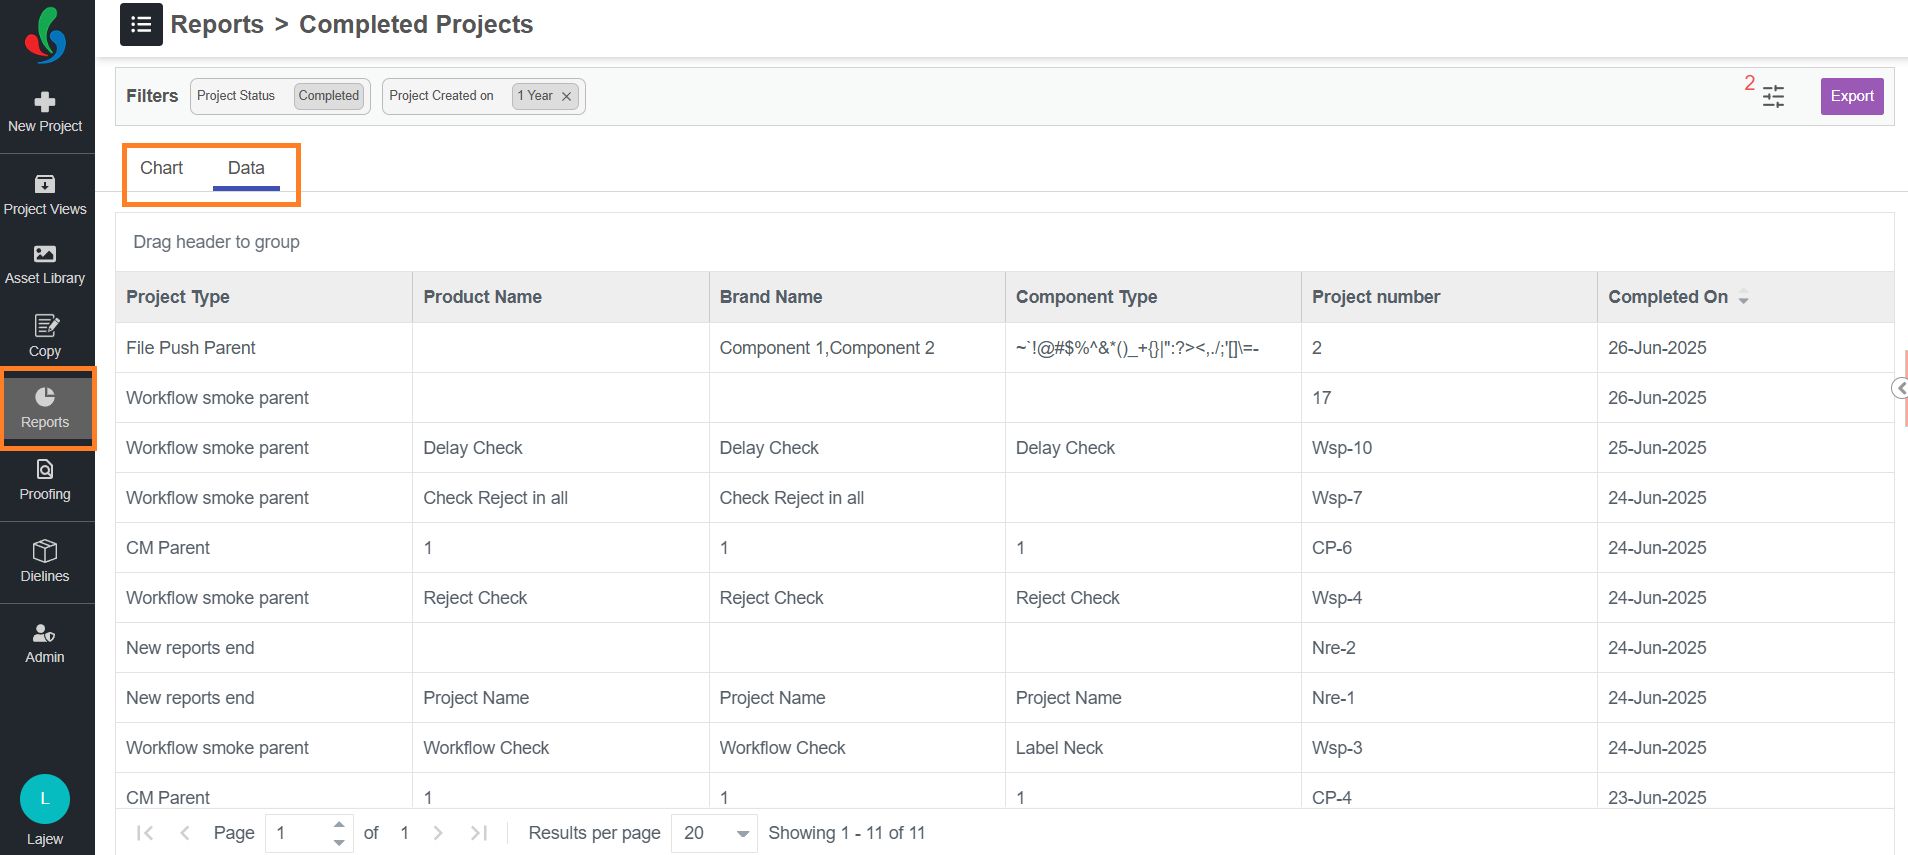
You can click on any report to open its drill-down view, which provides in-depth insights and metadata related to the selected report item. For example, selecting the Completed Projects report opens a detailed view displaying all completed projects along with their associated information.
The drill-down view consists of two main tabs:
- Chart Tab:
Displays a graphical representation of the report data using charts for visual analysis. - Data Tab (default view):
Presents the data in a table format, showing detailed metadata such as project type, product name, brand name, component type, creation date, and more.
Customizing the Drill-Down Table
| Note:
|
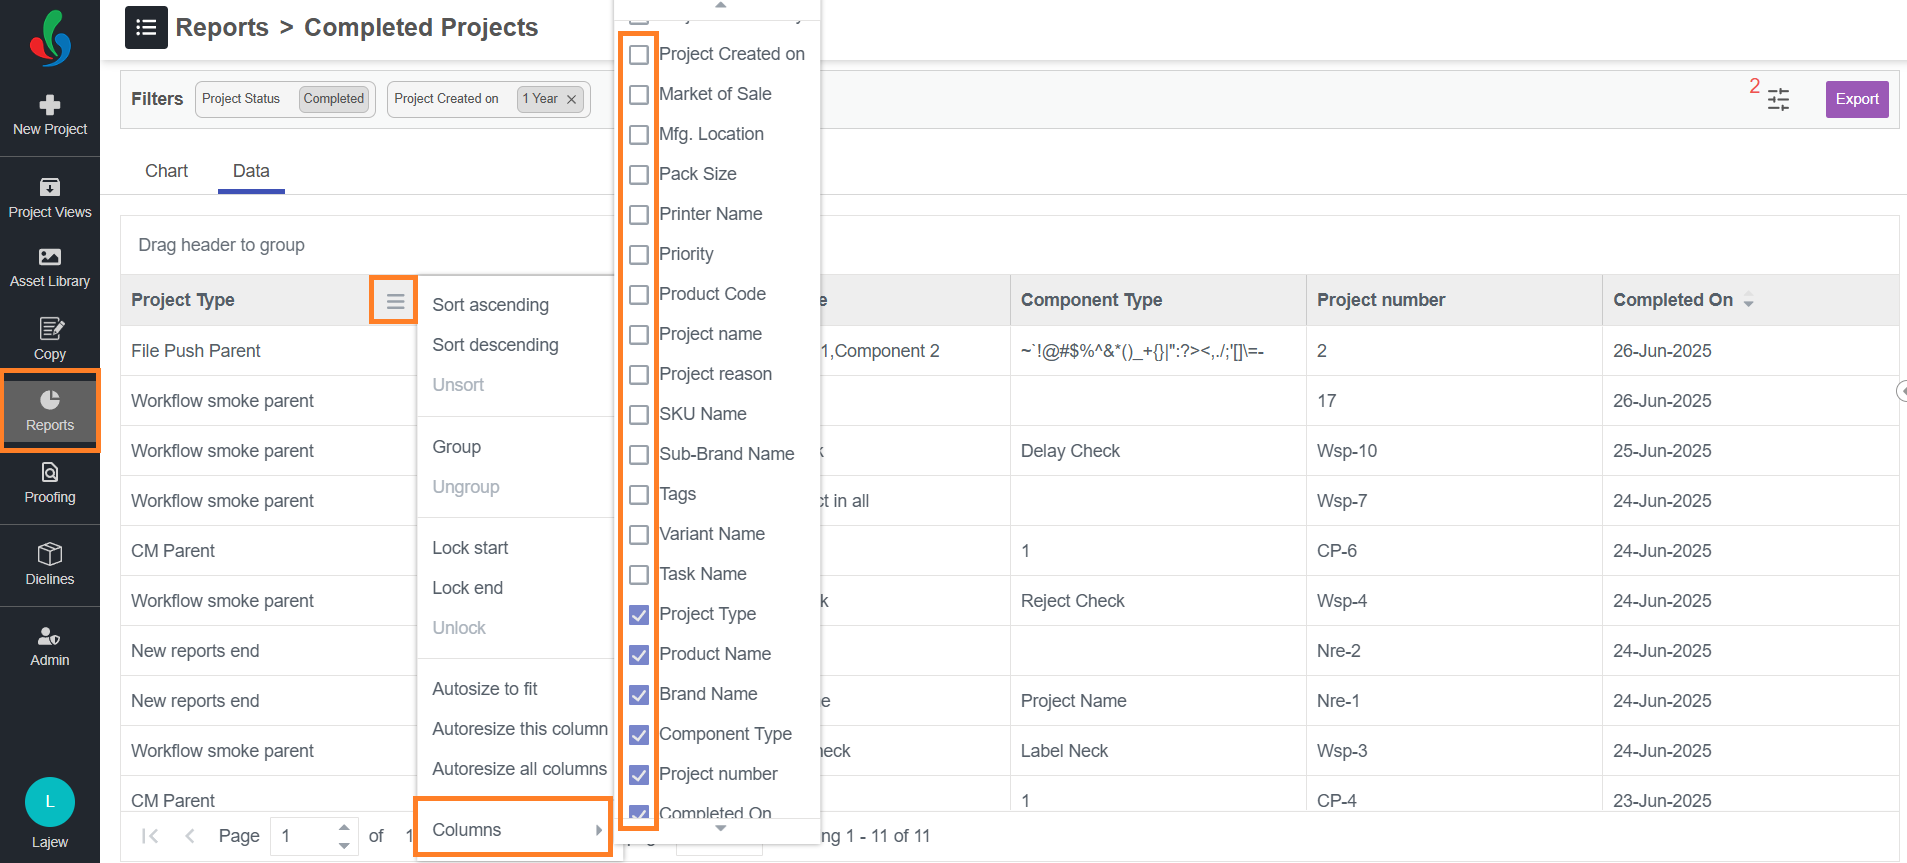
Manage Display Fields
- Add Fields: Hover over existing display fields in the header row. Click the hamburger icon and hover over "Column." A list of available fields will appear. Select the desired metadata field you want to add by checking the boxes next to their names.
- Remove Fields: Uncheck the boxes next to any fields you want to remove from the view.
- Rearrange Columns: Click and drag the column headers to reposition them in the desired order. Prioritize the information you access most frequently.
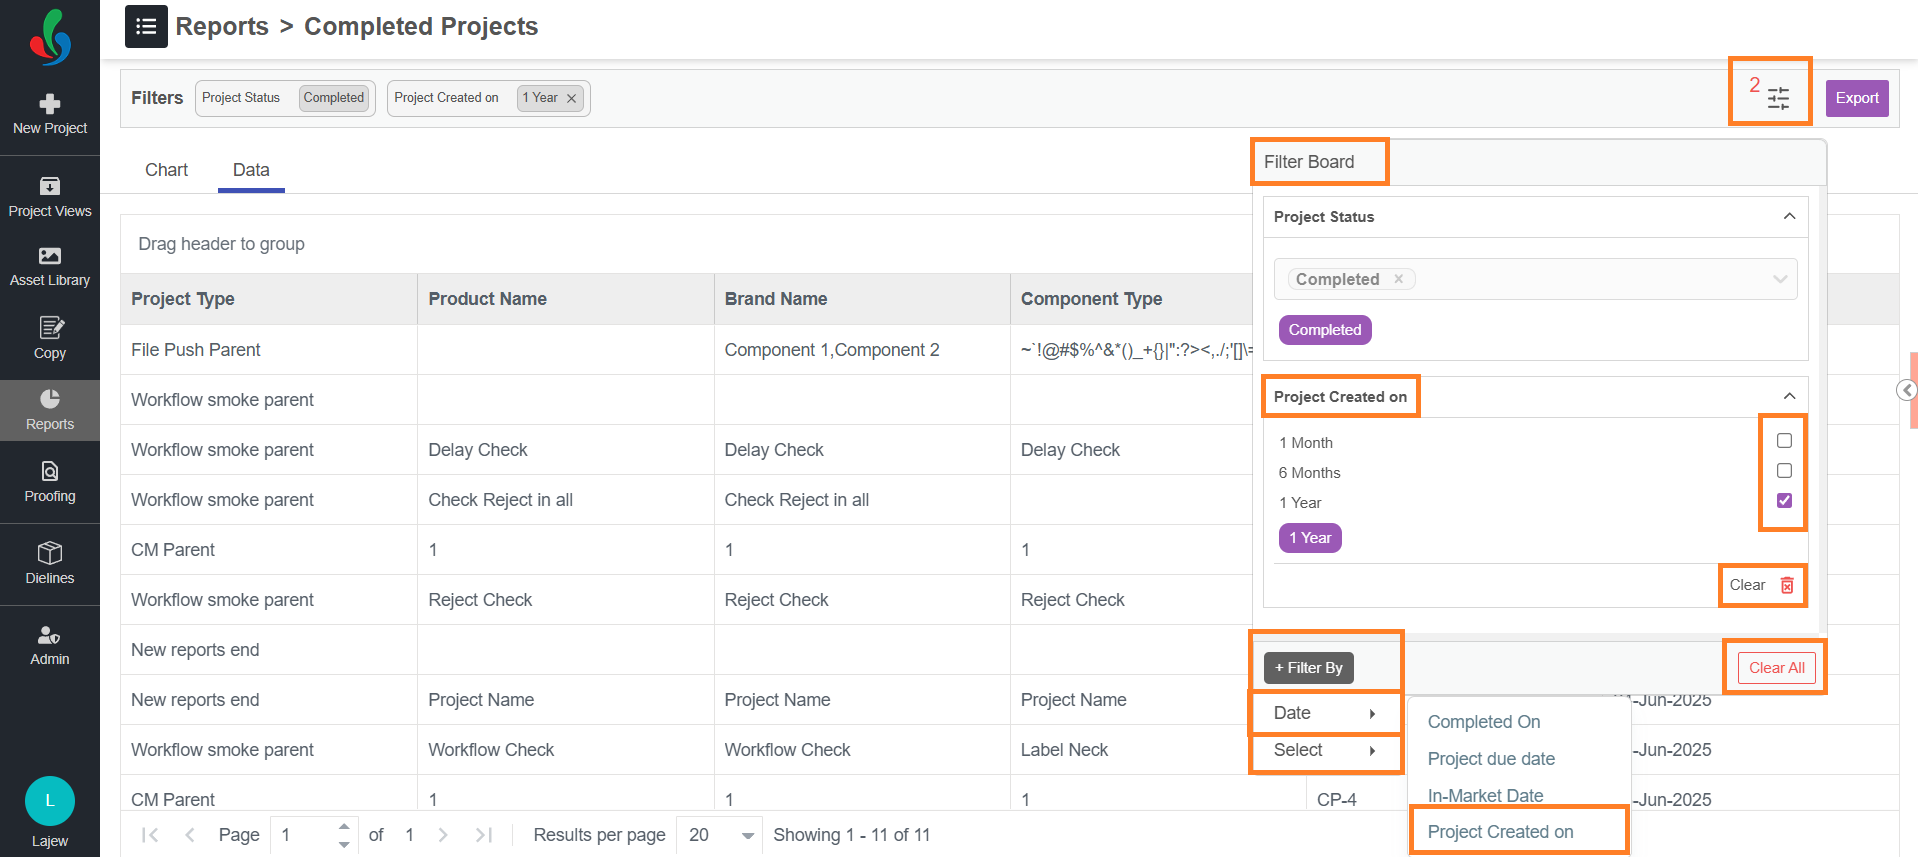
Filtering Data in the Drill-Down View
You can apply filters to refine the results shown in the report.
- Click the Filter button to open the filter board.
- All currently applied filters will be listed in the filter board.
- Select appropriate values for each filter field to refine the data view.
- To add a new filter, click + Filter By and choose from the available filter types.
- Filter Types:
- Date: Use this option to filter records based on date fields such as Project Created On or Completed On. Choose a relevant date field from the list to add it to the filter board.
- Select: Use this option to filter data based on metadata fields like Project Type, Status, Product Name, etc. Choose a field from the list to add it to the filter board.
- Once filters are added, select the appropriate values associated with it to refine the data view.
- Managing Filters:
- To remove a specific filter, click the trash icon associated with that filter in the filter board.
- To clear all filters, click the Clear All button at the bottom of the filter board.
Exporting Report Data
You can export the visible data in the drill-down view:
- Click the Export button at the top right corner of the table.
- The data currently displayed on screen will be downloaded as an Excel (.xlsx) file.
| This feature is useful for offline analysis, sharing reports, or maintaining historical records. |